
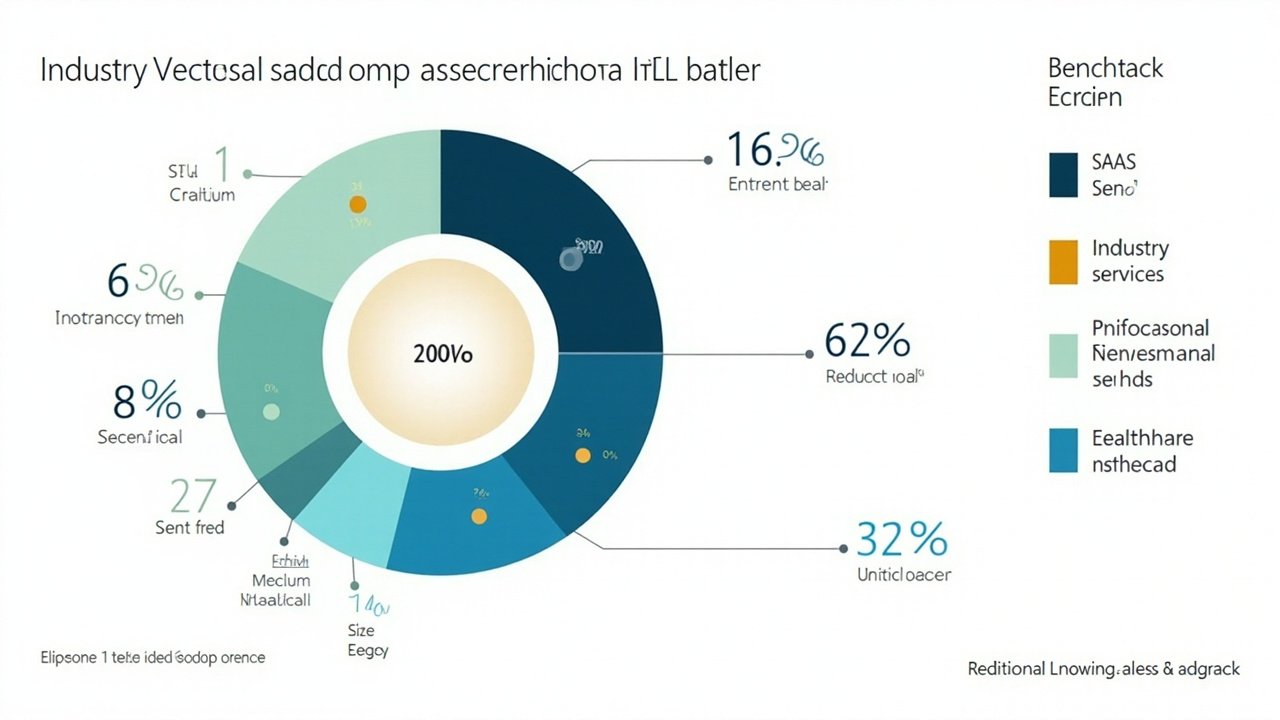
Every B2B marketing leader asks the same question at some point in 2026: 'Is our lead conversion rate good?' The honest answer is always the same: 'Compared to what?' A 2% conversion rate is failing for a SaaS team selling $50K ACV deals with a 6-month cycle, and it is best-in-class for an industrial team selling $400K machinery deals with a 14-month cycle. HubSpot's 2026 State of Marketing report captured this variance across 4,200 B2B organizations, and the headline number — a 13.2% median MQL-to-SQL conversion rate — is essentially meaningless without the industry context that explains why the variance ranges from 6% (financial services) to 22% (SaaS). The B2B leader who does not understand this variance will misdiagnose their own performance, set the wrong targets, and either miss the real opportunity in their funnel or over-invest in a problem they do not have.
The median 2026 B2B MQL-to-SQL conversion rate across all industries sits at 13.2%, with the top decile hitting 41%+ and the bottom quartile sitting at around 4% (HubSpot 2026). That is a 10x delta between median and top decile, and the variance is almost entirely explained by three factors: industry vertical (sales-cycle length and average deal size), ICP precision (how tightly the lead matches the target buyer profile), and lead-response time (how fast the team responds to a new inbound request). The mid-market B2B leader who wants to be in the top decile typically controls about 60% of these three factors — the industry vertical is fixed by the business model, but ICP precision and lead-response are fully manageable. The leader who is currently in the median band can typically move 1-2 deciles upward in 12-18 months by tightening the ICP discipline and instrumenting the lead-response time to <5 minutes during business hours.
Top quartile B2B organizations convert 31% of marketing-sourced leads to opportunity and 7.8% to closed-won within the same year; bottom quartile converts 6% to opportunity and 1.4% to closed-won (Salesforce State of Sales 2026). The 5x delta between top and bottom quartile is the gap that 2026 winners are capturing through three operating mechanisms: ICP precision (the lead definition matches a narrow buyer profile and filters out the long-tail), lead-response time (<5 minutes during business hours, <30 minutes outside business hours), and multi-touch follow-up (3-5 tailored touches across 14-21 days, not one drip email). The brands sitting in the bottom quartile typically fail on at least two of these three mechanisms, and the brands sitting in the top quartile run all three with consistent cadence. The 5x delta is not mysterious — it is the operating discipline compound across hundreds of leads.
Industry-segmented 2026 benchmarks from Ruler Analytics tell the real story for most mid-market B2B leaders. SaaS median lead-to-deal conversion sits at 3.8%, with the top decile at 9.4% — meaning a SaaS team that converts 4% is exactly at the median, a team that converts 9% is best-in-class for their vertical, and a team that converts 12% is an extreme outlier that probably is under-counting deals or missing the cohort normalization. Industrial teams convert at 1.2% median, top decile 4.1% — the gap between median and top is 3.4x, similar to SaaS but on a smaller base. Professional services teams convert at 2.4% median, top decile 6.8% — slightly higher than industrial and slightly lower than SaaS, with the variance coming from the mix of consulting vs agency vs staffing. Financial services teams convert at 0.9% median, top decile 3.2% — the lowest of any major vertical and the one where median performance is most painful. Healthcare B2B (non-provider) sits at 1.7% median, top decile 5.4% — the wild-card vertical where the variance reflects whether the team is selling to providers, payers, or pharma.
The lead-response 5-minute rule still holds in 2026, and the Ruler Analytics benchmark reinforces the point with sharp data. Median 2026 B2B team response time to a new inbound lead is 4 hours 22 minutes. Top decile response time is 5 minutes. Conversion rate drops 80% when response time exceeds 60 minutes — meaning a lead contacted in 4 hours has a fifth the conversion probability of a lead contacted in 5 minutes (Ruler 2026). The math is brutal: a team that handles 1,000 inbound leads per month at the 4-hour-22-minute median will close roughly 38 deals; the same team with a 5-minute response time would close roughly 188 deals on the same lead volume. The cost of the slow response is approximately $5-8M of lost revenue per month on $50K ACV SaaS — and the fix is routing the inbound lead directly to a sales-development rep's phone rather than into a CRM queue that gets touched the next morning.
The 4B framework for setting a conversion target in 2026 is a sequence of four decisions that anchor the team on a vertical-appropriate target rather than a generic number. Step one: Benchmark by industry vertical. Use Ruler Analytics or HubSpot's industry-specific data to find the median and top-decile benchmark for your specific vertical. Step two: Basemate to last quarter. Compare your last-quarter conversion rate to your last-year's, and identify whether you are trending up, flat, or down. Step three: Beat the median. Set the median as the floor, commit to beating it within two quarters. Step four: Build to top decile. Once you have beaten the median for 3+ quarters, set the top-decile benchmark as the next target and plan the operating mechanism to get there.
How deal-size weighting changes the math is the second trap that B2B leaders fall into when interpreting conversion benchmarks without context. A 0.8% conversion at $500K average deal size generates $4,000 of expected revenue per lead attempted; a 4% conversion at $20K average deal size generates $800 of expected revenue per lead attempted. The lower-conversion team is producing 5x the revenue per lead, but the higher-conversion team looks better on the dashboard. The mid-market B2B leader who interprets conversion in isolation will over-invest in optimization that produces higher conversion rates but lower revenue per lead. The leader who understands the math will optimize for revenue per lead, not conversion rate, and will tolerate a lower-conversion-rate channel that produces higher revenue.
The top-decile operating mechanism in 2026 is the combination of four disciplines that compound to produce 9%+ lead-to-deal conversion in SaaS, 4%+ in industrial, and similar lifts in other verticals. Discipline one: ICP precision, expressed as a written one-pager that defines the firmographic (industry, size, geography), technographic (tech stack, intent signals), and demographic (role, seniority) profile of the perfect buyer. Discipline two: lead-response <5 minutes during business hours, instrumented through direct routing to an SDR's phone rather than CRM queues. Discipline three: multi-touch follow-up of 3-5 tailored touches across 14-21 days, with the content adapted to the role and the channel matched to the buyer's preference. Discipline four: quarterly ICP refresh based on the deals that actually closed — narrowing the ICP to the buyers who convert, broadening the outreach to the channels that reach them.
Why ignoring industry benchmarks leads to false confidence OR panic is the second-order effect that the 4B framework addresses. A SaaS team that benchmarks against the median (13.2% MQL-to-SQL) without looking at the SaaS-specific median (22%) will under-invest in the conversion rate and under-invest in the lead volume, missing the fact that they should be funding more top-of-funnel activity. An industrial team that benchmarks against the SaaS median (22%) will perceive themselves as failing at 8% and will make panicked changes to the lead definition that break the ICP. The fix is to anchor on the industry-specific benchmark, set the median as the floor, set the top decile as the next ambition, and run the operating disciplines that compound to produce the lift.
The 2026 top-decile benchmarks are achievable for most mid-market B2B teams within 12-18 months, but the operating discipline must be running consistently across all four mechanisms to get there. The team that implements ICP precision in Q1, lead-response in Q2, multi-touch follow-up in Q3, and quarterly ICP refresh in Q4 will typically see 2-3 decile lift by the following year. The team that implements two of the four sees 1 decile lift; the team that implements only one sees marginal improvement. The compounding effect is not mysterious — it is the operating discipline compounding across all the leads, all the time. The 2026 winners are the teams that ran all four disciplines across all of 2024-2026, and the brands sitting in the top decile in 2027 will be the brands that start running all four today.
The 2026 quarterly cadence for resetting the conversion target is what separates the teams that climb the decile ladder from the teams that plateau. The brand that runs a quarterly target-setting review — reviewing the actual conversion rate against the industry benchmark, identifying which of the four operating disciplines is the weakest, and committing to a specific 90-day improvement in that one discipline — typically moves 1 decile per quarter. The brand that runs an annual review against a generic industry benchmark typically moves 0.5 decile per year. The discipline is the operating cadence, not the target number; the target is downstream of the discipline. The teams that climbed from the median (13.2%) to the top decile (41%+) between 2023 and 2026 typically committed to a 90-day operating discipline every quarter, ran the four-discipline scorecard, and adjusted the weakest discipline each cycle. The compounding effect over 12 quarters is what produces the 4x lift from median to top decile, and the brand that starts the discipline today will see the cumulative lift by mid-2027.
The 2026 winners are also the teams that instrument the per-source conversion rather than the aggregate. A team that runs three lead sources — paid search, organic content, and partner referrals — and measures each source's conversion rate separately will find that the sources do not perform equally. Paid search might deliver 6% conversion, organic content 12%, partner referrals 22%. The aggregate is the weighted average, but the per-source view is where the investment decision lives. The brand that doubles down on partner referrals and dials back paid search can lift the aggregate conversion rate by 30-50% in one quarter without changing anything about the lead-response or ICP discipline. The 2026 winners run the per-source scorecard monthly, not annually, and reallocate the lead-volume budget to the highest-converting sources within 30 days of the data landing. The operating cadence compounds across the four disciplines and the per-source reallocation, and the lift shows up in the team-level metric by mid-year.