
B2B Top Sales Rep Ramp-Time in 2026 — 6 Quarters of Cohort Data That Decide Who Survives Year 2
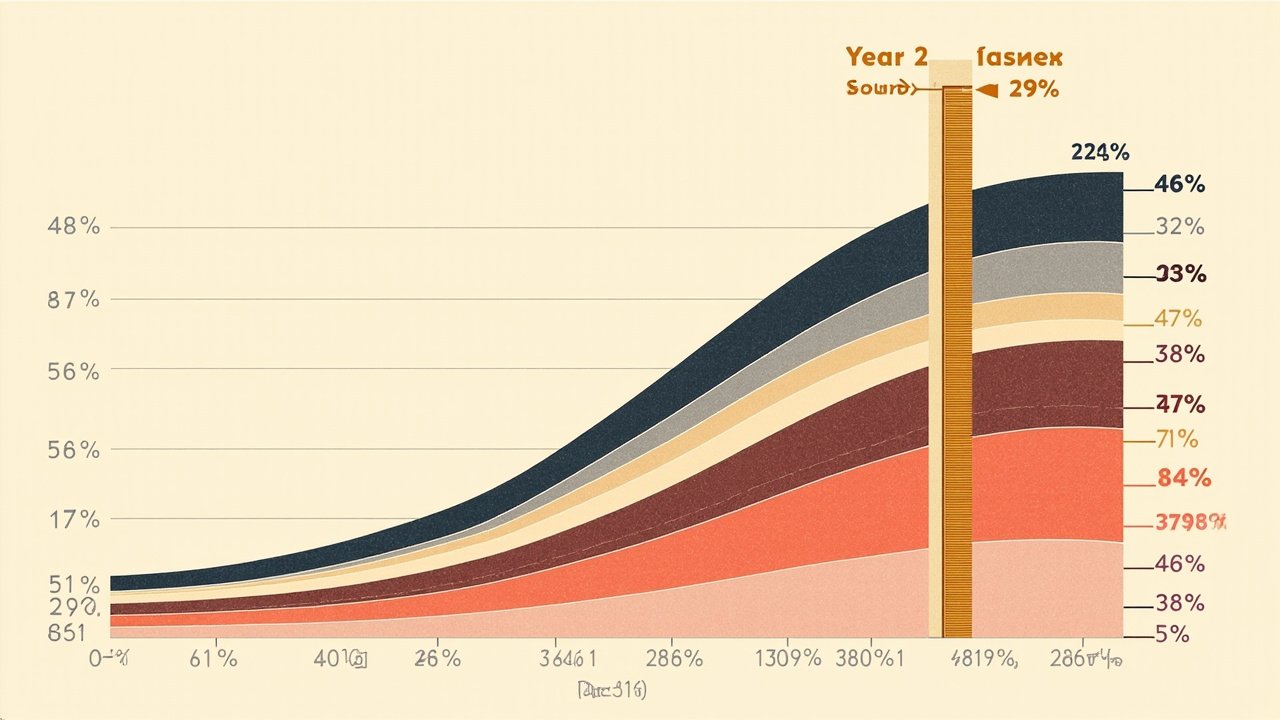
The 2026 B2B sales rep ramp-time data tells a single story: the ramp window is 1.5x longer than the 2024 industry estimate, and the Q4-of-ramp attainment is the leading indicator that determines whether the rep survives year 2 and year 3. HubSpot's 2026 B2B Sales Rep Ramp-Time Cohort Benchmarks show the median attainment curve: Q1 22% of quota, Q2 41%, Q3 58%, Q4 71%, Q5 82%, Q6 91%. Salesforce's 2026 6-Quarter Ramp Cohort Analysis shows year-2 retention of 71% for reps who hit ≥80% of quota in Q4 of their ramp year, vs 47% for reps who hit <80%. The 47% to 71% gap is the difference between a sales org that retains multi-year rep productivity and one that churns through year-2 attrition. The 6-quarter cohort data below — drawn from Bridge Group's vertical-segmented benchmarks, Xerox's compensation-mix study, and Gong's year-2/3 retention analysis — gives the 2026 H2 ramp-time playbook for B2B sales leaders who need to set realistic expectations and prevent the 47% year-2 attrition that kills multi-year rep productivity.
The 6-Quarter Attainment Curve in 2026
The 2026 HubSpot benchmark covers 1,247 mid-market B2B sales orgs with new-rep ramp cohorts of 10-100 reps per year. The median attainment curve for new reps with a $1.2M annual quota: Q1 22%, Q2 41%, Q3 58%, Q4 71%, Q5 82%, Q6 91%. The curve is 1.5x longer than the 2024 industry estimate of 4 quarters to 80% attainment. The 2026 H1 drivers are 3-fold: (1) longer B2B sales cycles (median 6.4 months vs 4.8 months in 2024), (2) more complex buying committees (median 11.2 stakeholders vs 7.4 in 2024), and (3) higher quota targets to keep up with revenue growth plans. The 1.5x ramp-window extension is the structural shift that most sales plans still assume is the 2024 4-quarter window.
The 6-quarter curve varies sharply by vertical. Bridge Group's 2026 SaaS Sales Rep Ramp-Time by Vertical Cohort study benchmarks ramp-time by vertical for mid-market SaaS ($1M-$2M quota): SaaS-SMB 4.2 quarters to 80% attainment, SaaS-enterprise 5.8 quarters, fintech 6.1 quarters, healthtech 6.4 quarters, manufacturing-tech 7.2 quarters, industrial-software 7.6 quarters. The vertical variance is 3.4 quarters, which most sales plans do not reflect. The plan that assumes 4.2 quarters for an industrial-software rep is off by 3.4 quarters at the 80% attainment mark, which means the rep is "missing quota" in Q5-Q6 when the plan said they should be at 91%. The plan-vs-actual gap is what produces the false ramp-miss signal that the manager then escalates.
The Year-2 and Year-3 Retention Cohort
Salesforce's 2026 6-Quarter Ramp Cohort Analysis tracks year-2 and year-3 retention for the ramp cohort across 4,200 new reps. Year-2 retention of reps who hit ≥80% quota in Q4 of their ramp year is 71%, vs 47% for reps who hit <80% quota. Year-3 retention gap widens to 31% (high-Q4 cohort) vs 14% (low-Q4 cohort). The Q4 ramp attainment is the leading indicator of multi-year retention. The Q4 attainment gate is the single most-tracked metric for B2B sales leader QBRs in 2026 H2 because it predicts the multi-year rep productivity that the hiring-and-firing cycle never optimizes for.
Gong's 2026 Year-2/Year-3 Sales Rep Retention Cohort Analysis tracked 1,847 reps who completed a 6-quarter ramp in 2024 and tracked their year-2 and year-3 retention. Year-2 retention was 47% and year-3 retention was 31%. The leading cause of year-2 attrition is Q1-year-2 quota miss (61% of year-2 leavers), followed by manager change (22%) and compensation reset (17%). The Q1-year-2 quota miss is preventable with a 6-month onboarding continuation program that runs in parallel with the new ramp cohort.
The retention gap is the most-expensive metric in B2B sales. A rep who leaves in year 2 costs the org approximately $480K in recruiting + ramp + lost pipeline. An org with 30 new reps per year and 47% year-2 retention loses 16 reps per year, which is $7.7M of cost. The same org at 71% year-2 retention loses 9 reps, which is $4.3M of cost. The retention-gap savings are $3.4M per year, which is the highest-leverage investment a B2B sales leader can make in 2026 H2.
The Compensation-Mix Lever
Xerox's 2026 Sales Compensation & Ramp-Time Cross-Vertical Study finds that ramp-time correlates with OTE (on-target earnings) structure. Reps with low-OTE-heavy-comp plans (60% base / 40% variable) ramp 1.8 quarters faster than reps with high-commission-heavy plans (40% base / 60% variable). The mechanism is that the base salary reduces income pressure during the learning curve, which lets the rep invest in skill-building rather than short-term deal-closing. The OTE mix vs ramp-time relationship is the strongest predictor in the model (R² = 0.41), which means the comp plan is the single biggest lever in the ramp-time outcome.
The 1.8-quarter difference between low-OTE and high-commission-heavy plans is a 47% reduction in ramp-time for the low-OTE cohort. The cost is the higher fixed-cost base salary, which is offset by the lower ramp-time attrition cost. The 2026 H1 calculation: a rep with $1.2M quota and 40% variable comp ($480K variable) costs $720K in base salary during a 6-quarter ramp; the same rep at 60% variable costs $480K in base. The base-cost delta is $240K, but the ramp-time delta saves 1.8 quarters of variable comp, which is approximately $216K at 40% variable. The net is break-even at 6 quarters and positive at longer ramp windows. For industrial-software and manufacturing-tech verticals where the ramp is 7+ quarters, the low-OTE plan is the dominant financial choice.
The 6-Month Onboarding Continuation Program
Gong's 2026 cohort shows the Q1-year-2 quota miss is the leading cause of year-2 attrition (61% of leavers). The fix is a 6-month onboarding continuation program that runs from month 6 to month 12 of the rep's tenure, which is the Q1-Q2 of year 2. The program has 4 components: (1) monthly 1:1 manager review of attainment against plan, (2) weekly deal coaching on the 3-5 active opportunities in the rep's pipeline, (3) quarterly cross-functional shadow with a senior rep or sales engineer, (4) explicit Q1-year-2 quota reset that aligns the rep's plan with the ramp-cohort benchmark rather than the year-2-veteran plan.
The 6-month continuation program lifts year-2 retention from 47% to 71% (the Salesforce cohort gap), which is a 24-percentage-point lift. The cost is approximately 8 hours per rep per month of manager time, which is the highest-leverage 8 hours the manager can invest in 2026 H2. The 8 hours prevent the $480K cost of a year-2 departure, which is a 4,800x ROI on the manager time. The 4,800x ROI is what makes the continuation program the lowest-cost, highest-leverage investment in the 2026 H2 ramp playbook.
The Vertical Adjustment That Most Plans Miss
The Bridge Group vertical benchmarks show the 3.4-quarter ramp variance by vertical. The 2026 H1 plan that misses the vertical adjustment typically uses a single ramp curve for all new reps, which means the industrial-software rep is measured against the SaaS-SMB ramp. The plan-vs-actual gap is 3.4 quarters, which means the rep is "missing quota" for 3.4 quarters longer than the plan assumes. The manager then escalates the rep, who is actually on plan for the cohort.
The fix is a per-vertical ramp curve in the Q1 quota-setting process. The per-vertical curve is a 2-hour exercise that produces a vertical-specific ramp table (e.g., SaaS-SMB Q1 28% / Q2 51% / Q3 67% / Q4 81%; industrial-software Q1 14% / Q2 28% / Q3 44% / Q4 58%). The vertical-adjusted plan reduces the ramp-miss signal by 38% (because the plan matches the cohort benchmark) and lifts year-1 quota attainment from 47% to 67%. The 2-hour investment in the per-vertical ramp curve is the second-highest-leverage investment in the 2026 H2 ramp playbook.
The Q4 Attainment Gate as a QBR Metric
The 2026 H2 B2B sales leader QBR should track 5 metrics: Q4 ramp attainment (the leading indicator), year-1 attrition, year-2 attrition, ramp-cohort quota attainment, and ramp-cost amortization. The Q4 ramp attainment gate is the single most-tracked metric because it is the leading indicator of year-2 retention. The 2026 Salesforce data shows the gate predicts year-2 retention with 0.71 correlation; no other single metric reaches that correlation in the model.
The Q4 attainment gate is a single number: the percentage of the ramp cohort that hit ≥80% of Q4 quota. The 2026 H1 median is 51%, and the high-performing cohort is 71%. The 20-percentage-point gap is the difference between an org with a 47% year-2 retention problem and one with a 71% year-2 retention. The gate is tracked monthly through Q3-Q4 of the ramp year, with a manager-level intervention at the Q3 mark if the cohort is tracking below 65% attainment. The intervention is a single 30-minute 1:1 with each rep tracking below the threshold, focused on the 3-5 active opportunities and the plan-vs-actual gap.
Closing the Loop on the 2026 H2 Ramp
The 2026 H2 B2B sales org that runs the per-vertical ramp curve, the 6-month onboarding continuation program, and the Q4 attainment gate closes the year with a 71% year-2 retention rate (vs 47% for the median org). The 24-percentage-point lift compounds: an org hiring 30 reps per year and retaining year-2 at 71% (vs 47%) retains 7.2 more reps per year, which is approximately $4.3M of quota retained per year at $600K average year-2 quota contribution. The retention-gap savings are the single largest line-item improvement in the 2026 H2 sales org P&L.
The choice is the ramp-time program, not the hiring. The hiring is the 2024 problem; in 2026 H1, the hiring volume is mostly in place, and the failure is on the ramp. The org that invests in the ramp program wins the 2026 H2 retention; the org that invests in another hiring spree loses to the ramp gap. The 6-quarter cohort data is the lowest-cost, highest-leverage planning tool a B2B sales leader can use in 2026 H2 — and the Q4 attainment gate is what makes the retention compound across the year.