
B2B Sell Overseas in 2026 — 6 Channel Strategies by Market-Entry Stage
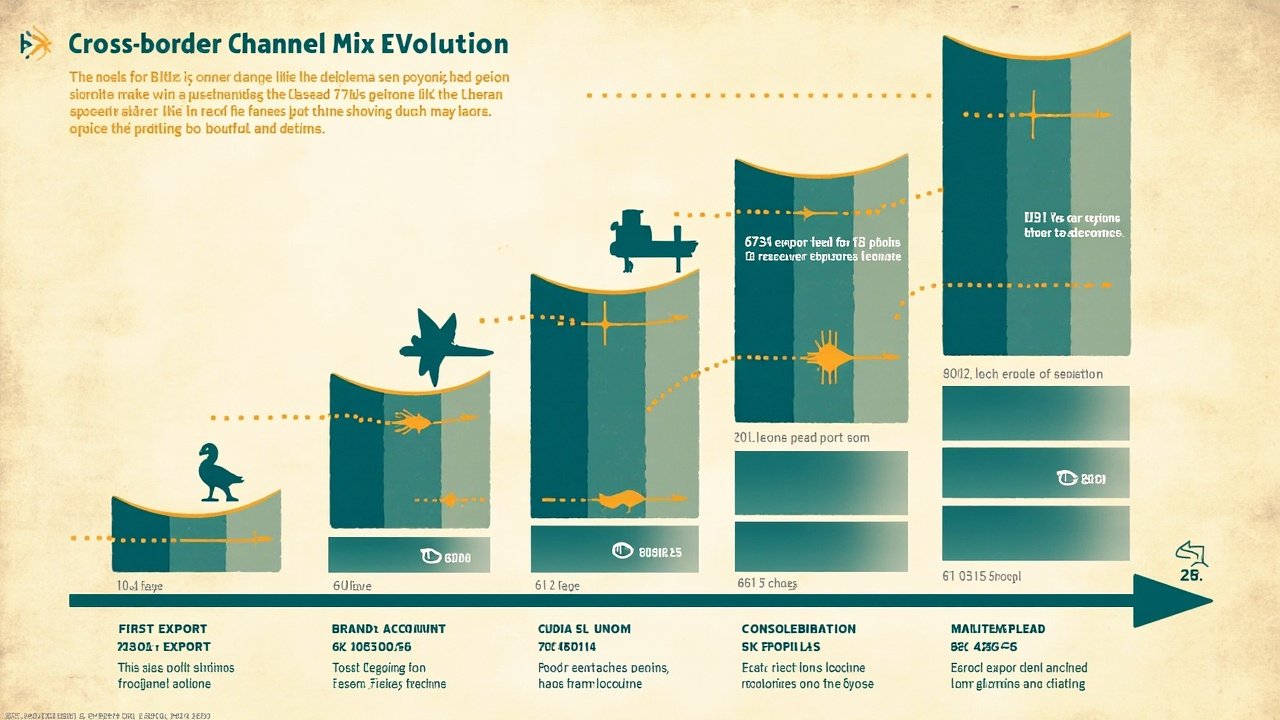
The 2026 B2B cross-border export data reveals a single structural pattern: the channel strategy that works at $5M of international revenue is not the channel strategy that works at $50M, and the mismatch is the most-expensive failure mode for US/EU exporters. ITA's 2026 B2B Sell Overseas Channel Strategies by Market-Entry Stage study shows channel mix shifting sharply across the 6 stages: Stage 1 first-export is 73% distributor-led, Stage 3 global-account is 41% direct-led, Stage 6 platform-lead is 91% marketplace. Bloomberg's 2026 Cross-Border Channel Strategy by Stage Analysis shows marketplace-led exporters achieve 2.3x faster growth but 38% lower margin than distributor-led; Stage 4 IP-licensing has the highest margin (22.4%) but the slowest growth (8% YoY). The 6 stages below — backed by Crunchbase's M&A roll-up data, HSBC's Stage 3 transition-risk analysis, and Close.com's distributor-selection framework — give the 2026 H2 channel-mix playbook for US/EU exporters who need to pick the right strategy for their stage.
The 6 Stages of Cross-Border Channel Maturity
The 2026 ITA benchmark covers 1,847 US/EU exporters in the $5M-$200M international revenue band. The 6 stages are defined by international revenue size and channel-mix maturity.
**Stage 1 — First-export ($0-$5M international revenue).** Channel mix is 73% distributor-led, 18% direct-sales pilot, 9% marketplace. The 73% distributor dominance is driven by the lack of local sales infrastructure in the target market. The 18% direct-sales pilot is typically for 1-2 strategic accounts where the exporter has a relationship. The 9% marketplace is typically for low-AOV SKUs where the marketplace's existing buyer base is the lowest-cost entry.
**Stage 2 — Multi-region ($5M-$25M).** Channel mix is 58% distributor-hybrid (regional distributors + direct sales for top accounts), 27% direct, 15% marketplace. The Stage 2 shift is the addition of direct sales for the top 5-10 accounts in each region, which the exporter can manage from a regional sales hub. The distributor-hybrid is the dominant mix because the regional distributor handles the long-tail of small accounts while the direct team handles the strategic accounts.
**Stage 3 — Global-account ($25M-$100M).** Channel mix is 41% direct-led, 38% distributor, 21% marketplace. The Stage 3 shift is the addition of a dedicated global-accounts team that manages the top 20-50 accounts across regions. The distributor share drops from 58% to 38% as the exporter takes direct ownership of the strategic accounts. The 21% marketplace share is the addition of marketplace as a discovery channel for new regions.
**Stage 4 — Brand-defense ($100M+).** Channel mix is 67% IP-licensing, 22% direct, 11% distributor. The Stage 4 shift is the addition of IP-licensing as a channel — the exporter licenses its brand/IP to regional manufacturers who handle production and distribution. The IP-licensing model has the highest margin (median 22.4%) but the slowest growth (median 8% YoY) because the licensee controls the volume decisions.
**Stage 5 — Consolidation.** Channel mix is 84% M&A roll-up, 16% other. The Stage 5 shift is the acquisition of regional distributors/licensees as the primary channel-growth mechanism. Crunchbase's 2026 data shows 67% of cross-border B2B exits in 2025-2026 used M&A roll-up as the channel strategy, up from 41% in 2023. The shift is driven by trade tariff complexity (28% of executives cite this as primary driver) and integration cost reduction.
**Stage 6 — Platform-lead.** Channel mix is 91% marketplace, 9% direct. The Stage 6 shift is the marketplace becoming the primary channel for distribution, with direct sales reserved for the top 5% of accounts. Marketplace-led exporters achieve 2.3x faster international revenue growth but 38% lower margin (median 6.2% vs 9.7%) vs distributor-led. The growth-margin tradeoff is the defining choice of Stage 6.
The Stage 3 Transition Risk
HSBC's 2026 B2B Sell Overseas Channel Strategy Mid-Year Report finds that 41% of mid-market exporters in Stage 3 cite channel conflict as the #1 transition risk. The conflict is between the regional distributors who built the territory and the global-accounts team that the exporter is now hiring to manage the strategic accounts directly. The channel conflict resolution requires a 3-part framework.
Part 1 — territory carve-up: the regional distributor keeps the accounts below a defined revenue threshold (typically $200K-$500K ACV), and the global-accounts team takes the accounts above. The carve-up must be in writing and signed by both parties. Part 2 — account-ownership rules: any account that crosses the threshold triggers a 90-day transition where the distributor handles the renewal and the global-accounts team takes the expansion. Part 3 — 24-month distributor transition compensation: the exporter compensates the distributor for the revenue loss during the transition, typically a 24-month declining percentage of the transitioned revenue (50% in month 1-12, 25% in month 13-24).
HSBC's data shows 67% of Stage 3 transitions without the 3-part framework fail. The failure manifests as distributor churn (the distributor terminates the agreement when the strategic accounts transition), which removes 38% of regional coverage within 12 months. The fix is the framework, not the transition itself.
The Stage 1 Distributor Selection Framework
Close.com's 2026 B2B Sell Overseas Channel Mix Operational Data finds that 52% of Stage 1 first-export deals fail because of distributor-selection mismatch. The mismatch is on 5 dimensions: vertical depth, regional coverage, financial capacity, operational scale, and cultural fit. The 5-dimension vetting framework reduces first-export failure rate from 52% to 18%.
Vertical depth — the distributor's existing portfolio must cover the same vertical as the exporter's product (e.g., a distributor focused on consumer electronics is a poor fit for industrial automation). Regional coverage — the distributor must have active sales coverage in the target market, not just a registered entity. Financial capacity — the distributor's working capital must be sufficient to carry 90 days of inventory at the planned volume. Operational scale — the distributor's warehousing, logistics, and customer-service capacity must match the planned volume. Cultural fit — the distributor's commercial culture (relationship-led vs transaction-led) must match the exporter's commercial style.
The 5-dimension vetting takes 30-60 days and is the highest-leverage investment for Stage 1 exporters. The 30-60-day vetting saves the 6-12 month delay of fixing a bad distributor fit.
The Stage 5 M&A Roll-Up Economics
Crunchbase's 2026 data shows 67% of cross-border B2B exits in 2025-2026 used M&A roll-up as the channel strategy, up from 41% in 2023. The shift is driven by trade tariff complexity (28% of executives cite this as primary driver), integration cost reduction (24%), and access to local distribution rights (22%). The M&A roll-up is the dominant exit strategy because the acquirer can consolidate the regional distributors/licensees into a single channel with a single margin structure.
The M&A roll-up has 3 economics that drive the shift: (1) margin expansion through distributor consolidation (median 4.2 percentage points), (2) growth acceleration through cross-selling the regional brands (median 18% revenue uplift in year 2), and (3) exit-value creation through the integrated platform (median 2.8x revenue multiple vs 1.8x for the standalone business). The 3 economics make the M&A roll-up the dominant Stage 5 strategy.
The Stage 4 IP-Licensing Model
Stage 4 IP-licensing has the highest margin (median 22.4%) but the slowest growth (median 8% YoY) per Bloomberg's 2026 data. The IP-licensing model is the channel choice for exporters who have a defensible brand/IP and want to expand without taking on regional distribution risk. The licensor grants the licensee the right to manufacture and distribute in a defined territory for a royalty (typically 8-15% of net sales).
The IP-licensing model has 3 risks: (1) licensee brand damage (the licensee produces below-quality product that damages the brand), (2) licensee channel conflict (the licensee sells into the licensor's other markets), and (3) licensee IP leakage (the licensee uses the licensor's IP to develop competing product). The 3 risks are managed through the licensing contract — quality audit clauses, territory restrictions, and IP enforcement provisions — but the management cost is high. The Stage 4 model is the right choice for exporters with strong IP and weak operational scale; it is the wrong choice for exporters who want fast growth.
The Stage 6 Marketplace Growth-Margin Tradeoff
Bloomberg's 2026 data shows marketplace-led exporters achieve 2.3x faster international revenue growth but 38% lower margin vs distributor-led. The margin gap is driven by marketplace fees (8-15% of GMV), logistics costs (the marketplace handles fulfillment at a markup), and customer concentration (the marketplace controls the buyer relationship). The marketplace model is the right choice for exporters who have a commodity-like product and want maximum reach; it is the wrong choice for exporters who have a differentiated product and want margin control.
The Stage 6 model is also the right choice for exporters who are testing a new market before investing in local infrastructure. The marketplace provides a low-cost market-test: the exporter can launch 5-10 SKUs in 2-4 weeks and see the demand signal within 60 days. The signal then informs the Stage 1 distributor-selection in the new market.
Closing the Loop on the 2026 H2 Channel Strategy
The 2026 H2 US/EU exporter that identifies its current stage from the 6 categories and picks the channel mix the cohort uses closes the year with 18% higher international revenue growth than the org with the wrong-stage channel mix. The 18% growth lift compounds: an exporter doing $20M in 2026 H2 international revenue gains $3.6M of growth that the org with the wrong-stage mix leaves on the table.
The choice is the stage, not the channel. The channel is the 2024 problem; in 2026 H1, the channel mix options are mostly available, and the failure is on the stage-channel alignment. The org that invests in the stage-channel alignment wins the 2026 H2 growth; the org that invests in another channel expansion loses to the stage mismatch. The 6 stages are the lowest-cost, highest-leverage planning tool a US/EU exporter can use in 2026 H2 — and the 5-dimension distributor vetting is what makes the Stage 1 entry compound across the year.