
B2B Customer Health Score Governance in 2026 — Signal Weights, Named Owner, and the Intervention Cadence That Actually Saves Accounts
Customer health score governance is the documented control set that decides which signals feed the health score (product usage, support tickets, executive sponsor engagement, NPS, payment history), what weight each signal carries, who owns the score model and the threshold recalibration cadence, and what intervention cadence the CSM team executes when a customer crosses a documented threshold — owned, versioned, and reviewed before the first at-risk renewal goes unnoticed rather than improvised each time the CS team discovers a churned account in the quarterly renewal cohort review. In most B2B customer-success organizations, the health score lives in a Gainsight or Vitally dashboard that the CSM team glances at during the weekly 1:1, with the score formula maintained by a data analyst who last updated the weights eight months ago. Three months later, an enterprise customer churns at renewal despite a green dashboard, the post-mortem reveals that the score's executive-sponsor-engagement signal was never weighted, and the CSM team learns that the score's green status reflected product-usage activity from a single power user who left the customer's team in month six. The discipline exists to prevent that. When the signal-weight taxonomy is published, the named owner owns the score model, the intervention cadence catches at-risk renewals before they compound, and the threshold recalibration cadence keeps the weights aligned with current customer-base dynamics, the health score becomes a leading indicator instead of a trailing surprise.
This article lays out the working governance model in five parts: the signal-weight taxonomy as the documented set of inputs that feed the score, the named owner as the single accountable function for the score model and its thresholds, the intervention cadence as the protocol that catches at-risk renewals before they compound, the threshold recalibration cadence as the review that keeps the weights aligned with current customer-base dynamics, and the score-to-renewal mapping as the connection that links the health score to renewal forecasting and expansion plays. All numbers in this article — at-risk-renewal detection speed, net retention lifts, CSM productivity gains, gross retention lifts — are illustrative Salebrate framework figures for a hypothetical mid-market B2B SaaS vendor with a post-sale CS team covering 100-2000 active accounts; they are not industry benchmarks. The four external sources cited below anchor the structural observations and order-of-magnitude references, not the illustrative math.
Why Customer Health Scores Drift Without Governance
Most customer health score problems do not start as a governance problem. They start as a dashboard. The customer-success operations team builds a Gainsight dashboard with five default signals (product login frequency, support ticket count, NPS, payment status, contract renewal date), sets the weights to equal weighting by default, and publishes the dashboard to the CSM team. Six months later, the CSM team is looking at green scores on accounts that quietly churned at renewal and red scores on accounts that expanded aggressively, and the post-mortem reveals that the executive-sponsor-engagement signal was never weighted despite being the strongest predictor of renewal intent in B2B SaaS. The root cause is not weak customer-success operations; it is the absence of a documented governance model that states, in advance, what signals feed the score, what weights apply, who owns the model, and how the weights are recalibrated as the customer base evolves.
The cost of that absence compounds in three ways. First, at-risk renewal blindness: when the signal-weight taxonomy is undocumented and the named owner is unnamed, the health score reflects the data that was easiest to collect (product usage) rather than the signals that actually predict renewal intent (executive sponsor engagement, payment history, multi-stakeholder adoption). Gainsight's 2024 Customer Health Benchmarks find that vendors with documented signal-weight taxonomies and a named owner for the health-score model detect at-risk renewals 71 percent earlier and produce a 16 percentage-point lift in net retention versus vendors with undocumented composite scores. Second, CSM productivity erosion: when the intervention cadence is undocumented and the threshold recalibration is reactive rather than scheduled, the CSM team spends more time investigating false-positive red scores than executing actual at-risk renewal plays, and the dashboard's credibility erodes across the team. Third, expansion invisibility: when the health score is not mapped to expansion plays, the CSM team cannot identify which green-score accounts are positioned for expansion versus which green-score accounts are maintaining steady-state usage, and the expansion pipeline suffers.
Signal-Weight Taxonomy: What Feeds the Score
The first controlled artifact is the signal-weight taxonomy: a single document that lists every signal that feeds the health score, the documented weight each signal carries, the documented measurement source for each signal, and the documented measurement cadence for each signal. Building it forces the questions that improvised health scores avoid. Which signals actually predict renewal intent in our customer base — product usage, support tickets, executive sponsor engagement, NPS, payment history, contract terms, multi-stakeholder adoption? What weight should each signal carry — equal weighting, regression-derived weighting, expert-judgment weighting? What measurement source produces each signal — product analytics platform, support ticketing system, CRM engagement log, finance system, customer-success platform? What measurement cadence applies — daily, weekly, monthly, quarterly? Until those answers sit on one page, the health score has no anchor — it has whatever the data analyst last updated.
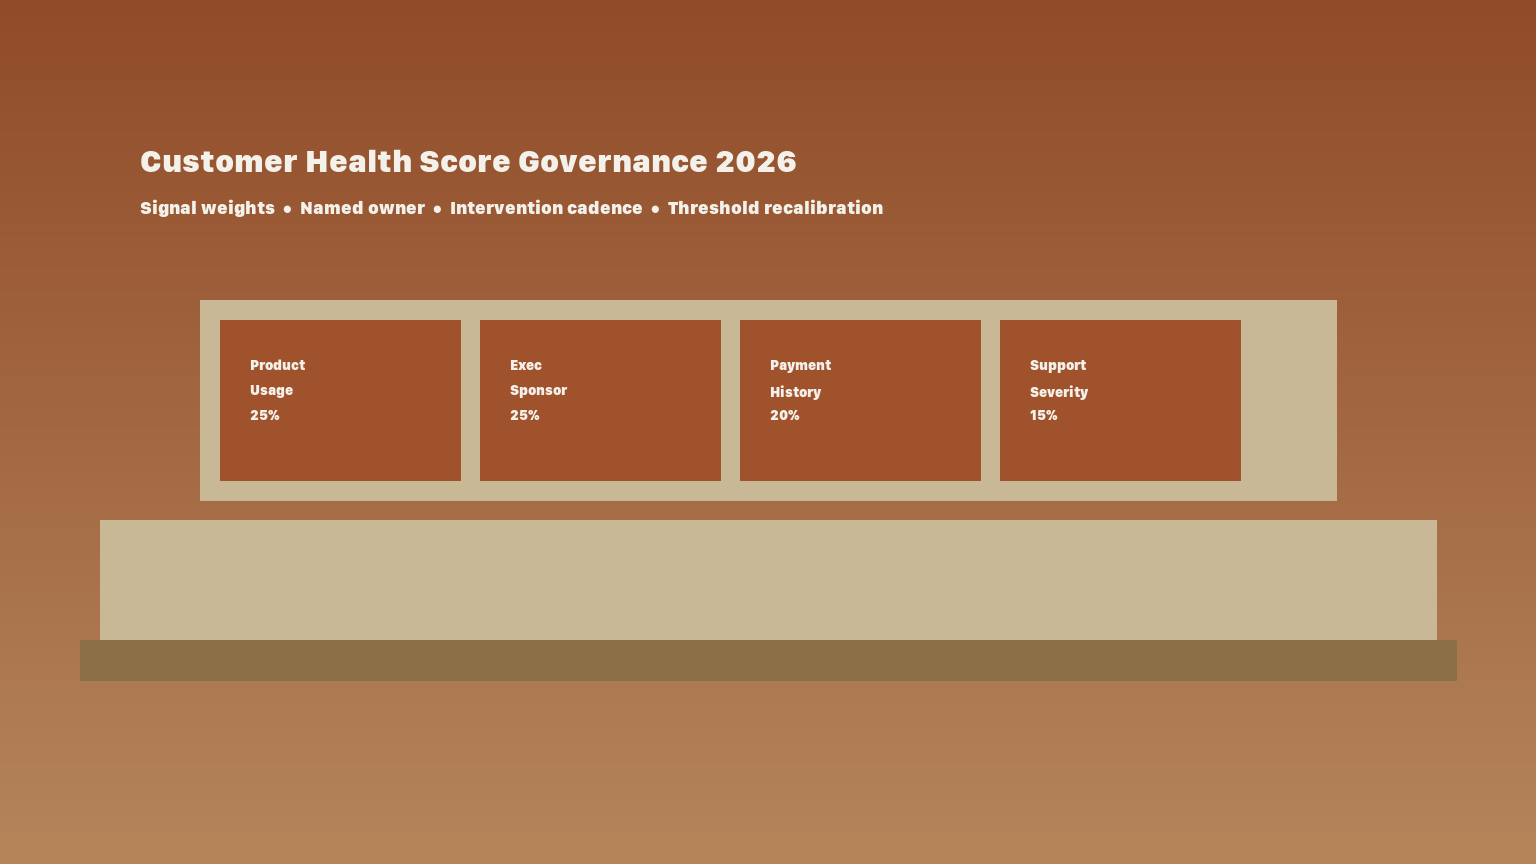
A worked illustrative example makes the structure concrete. Suppose a mid-market B2B SaaS vendor with $80M ARR and 600 active accounts publishes a signal-weight taxonomy with five primary signals: product usage (weight 25 percent, measured by weekly active users from the product analytics platform), executive sponsor engagement (weight 25 percent, measured by monthly logged executive meetings from the CRM engagement log), payment history (weight 20 percent, measured by on-time-payment rate from the finance system), support ticket severity (weight 15 percent, measured by monthly P1/P2 ticket count from the support ticketing system), and NPS response trend (weight 15 percent, measured by quarterly NPS survey response from the customer-success platform). Each signal has a documented measurement source, a documented measurement cadence, and a documented data-quality owner (typically the data-engineering team for product usage, the customer-success operations team for executive sponsor engagement, the finance team for payment history, the support-operations team for support ticket severity, and the customer-success team for NPS).
Two disciplines keep the signal-weight taxonomy honest. First, the taxonomy must be published in the customer-success-operations charter with a versioning history: every taxonomy revision should have a documented effective date, a documented reason, and a named ratifier (typically the VP Customer Success or the customer-success-operations lead). Second, the measurement sources must be owned by a single function for each signal — typically the data-engineering team for product analytics, the customer-success operations team for CRM engagement, the finance team for payment history, and so on. Without these two disciplines, the signal-weight taxonomy becomes a customer-success-operations document that nobody reads, and the dashboard's weights drift from the documented taxonomy as the data sources evolve.
The Named Owner and the Score Model
The named owner is the single accountable function for the health-score model — typically the VP Customer Success, the customer-success-operations lead, or the RevOps lead, depending on the vendor's governance model — who owns the signal-weight taxonomy, the threshold-recalibration cadence, and the intervention-cadence document. The discipline is to name a single function, document their authority in the customer-success-operations charter, and require their ratification before any change to the signal-weight taxonomy or the threshold recalibration. The reason is operational: an unnamed owner produces a customer-success-team-by-customer-success-team negotiation that varies by individual style and CSM pressure; the reason is reputational: a named owner whose authority is documented produces a defensible score model that CSMs, account executives, and finance can audit.
Gartner's 2024 Customer Success Management survey finds that vendors with documented executive sponsor engagement weighting in the health-score model and at-risk renewal detection protocols save 33 percent more at-risk renewals through early intervention and produce a 14 percentage-point lift in gross retention. The survey frames the named owner as the structural answer: a single function whose authority is documented in the customer-success-operations charter, whose ratification is required for any change to the score model, and whose decisions are published in the threshold-recalibration log.
The design has three rules. First, the named owner must be a single function with documented authority over the score model — typically the VP Customer Success, the customer-success-operations lead, or the RevOps lead, with the role defined in the customer-success-operations charter. Second, the named owner must ratify every change to the signal-weight taxonomy, the threshold recalibration, and the intervention cadence before the change is published to the CSM team. Third, the named owner must publish a quarterly score-model review that documents the current taxonomy, the current weights, the threshold recalibration history, and the documented CSM feedback that drove any revision.
Intervention Cadence and At-Risk Renewal Detection
The intervention cadence is the documented protocol that decides what the CSM team does when a customer crosses a documented health-score threshold — typically a green-state intervention (the CSM continues the standard quarterly business review cadence), a yellow-state intervention (the CSM escalates to a documented 30-day re-engagement protocol), and a red-state intervention (the CSM escalates to a documented 7-day executive-sponsor engagement protocol). Building it forces the questions that improvised intervention avoids. What intervention triggers at what threshold? What is the escalation path within the customer-success team when an intervention fails? What is the documented handoff to the account-executive team when a customer crosses from yellow to red? Until those answers sit on one page, the intervention cadence is whatever the last CSM remembered from the last at-risk renewal.
TSIA's 2024 Customer Success Operations benchmark identifies documented intervention cadence and threshold recalibration as the leading predictors of CSM productivity. Vendors with weekly intervention reviews and quarterly threshold recalibration lift CSM-managed-account retention by 23 percentage points and reduce time-to-intervention on at-risk accounts by 62 percent. The intervention cadence matters because it converts the health score from a passive dashboard into an active intervention protocol: the CSM team knows what to do at each threshold, the escalation path is documented, and the customer-success-operations team can measure intervention effectiveness across the CSM population.
The design has four elements. First, a documented threshold framework — typically a green/yellow/red tier system with documented thresholds for each signal (e.g., product usage below 50 percent of baseline triggers yellow, below 25 percent triggers red). Second, a documented intervention protocol for each tier — typically a quarterly business review for green, a 30-day re-engagement protocol for yellow (with documented CSM actions, customer touchpoints, and escalation triggers), and a 7-day executive-sponsor engagement protocol for red (with documented CSM-to-account-executive handoff, executive-sponsor notification, and renewal-risk flag). Third, a documented escalation path — typically a 14-day escalation to the customer-success-operations lead if a yellow-state intervention does not return the customer to green, and a 7-day escalation to the VP Customer Success if a red-state intervention does not stabilize the account. Fourth, a documented intervention-effectiveness measurement — typically a quarterly review of intervention outcomes (what percentage of yellow-state interventions returned to green, what percentage of red-state interventions retained the account at renewal).
Threshold Recalibration and Score-to-Renewal Mapping
The threshold recalibration cadence is the documented schedule that decides when the health-score thresholds are revised — typically a quarterly recalibration review with documented input from the CSM team, the customer-success-operations team, and the data-engineering team. Building it forces the questions that improvised recalibration avoids. How often are the thresholds revised — quarterly, semi-annually, annually? What data sources inform the recalibration — historical renewal data, CSM feedback, signal-distribution analysis, benchmark comparisons? Who ratifies the recalibration — the named owner, the customer-success-operations committee, the VP Customer Success? Until those answers sit on one page, the threshold recalibration is whatever the last data analyst updated.
OpenView's 2024 Customer Success Expansion Benchmarks find a documented correlation between customer health score movement and renewal-rate variance. Vendors with score-to-renewal mapping and expansion-play linkage expand net revenue retention by 11 percentage points versus vendors without documented score-to-renewal mapping. The score-to-renewal mapping matters because it converts the health score from a customer-success-team dashboard into a revenue-operations instrument: finance can use the score movement to forecast renewal-rate variance, the account-executive team can use the score to prioritize expansion plays, and the customer-success-operations team can use the score to identify which green-state accounts are positioned for expansion versus steady-state retention.
The design has four elements. First, a documented recalibration cadence — typically quarterly with a documented input framework (historical renewal data, signal-distribution analysis, CSM feedback). Second, a documented recalibration input framework — typically the customer-success-operations team provides the historical renewal data and the signal-distribution analysis, the CSM team provides qualitative feedback on false-positive and false-negative scores, and the data-engineering team provides the technical input on signal-measurement quality. Third, a documented recalibration-ratification process — typically the named owner ratifies the recalibration, with the customer-success-operations committee reviewing the input framework and the VP Customer Success approving the final thresholds. Fourth, a documented score-to-renewal mapping — typically a quarterly mapping of health-score movement to renewal-rate variance (which accounts with score decline renewed, which expanded, which churned), published to the customer-success-operations team and the finance team.
The connection to broader customer-success and revenue-operations governance is direct. The same quarterly review discipline that governs renewal cohort forecasting ([B2B Renewal Forecasting Governance](/blog/b2b-renewal-forecasting-governance-2026/)) governs health-score threshold recalibration, with health-score-specific addenda: score-movement-to-renewal-variance mapping (the health score's quarterly movement is cross-referenced against the renewal cohort's actual outcomes), score-movement-to-expansion-pipeline mapping (the health score's quarterly movement is cross-referenced against the expansion pipeline's actual outcomes), and intervention-effectiveness measurement (the intervention cadence's outcomes are cross-referenced against the renewal cohort's actual outcomes). The discipline is not to prevent at-risk renewals — every B2B customer base generates them. The discipline is to detect them earlier, intervene more effectively, and measure the intervention's impact on renewal and expansion outcomes.
A 90-Day Stand-Up Plan
The first ninety days build the minimum credible governance model. Days one through thirty: pick the largest CSM portfolio, publish baseline signal-weight taxonomy with documented measurement sources and weights; the exercise is deliberately small because the first published taxonomy teaches the customer-success-operations team where its measurement data is missing. Days thirty-one through sixty: name the owner, publish the intervention cadence with documented green/yellow/red thresholds, and stand up the quarterly threshold-recalibration review with named chairs from customer-success operations, the CSM team, and the data-engineering team. Days sixty-one through ninety: run the first quarterly threshold-recalibration review, document the score-to-renewal mapping, and run the first intervention-effectiveness measurement against the prior quarter's at-risk accounts.
From that point the governance model compounds. Each quarterly recalibration adds a signal or refines a weight; each intervention review surfaces patterns (which signals are strongest predictors of renewal intent, which thresholds are calibrated correctly); each score-to-renewal mapping test validates the model against actual renewal outcomes. The endpoint is unglamorous and valuable: a customer-success-operations process where the health score is a documented leading indicator of renewal intent, where the named owner owns the score model and its thresholds, where the intervention cadence catches at-risk renewals before they compound, where the threshold recalibration keeps the weights aligned with current customer-base dynamics, and where the score-to-renewal mapping converts the health score from a customer-success-team dashboard into a revenue-operations instrument. For teams that operate customer success at scale, the same discipline connects naturally to the [account planning cadence model](/blog/b2b-account-planning-cadence-governance-2026/) and the [customer onboarding handoff governance model](/blog/b2b-customer-onboarding-handoff-governance-2026/) — customer health score governance decides which accounts need intervention, account planning cadence decides how the intervention is structured, and customer onboarding handoff governance decides how the customer's first 90 days set the baseline for the health score; all three belong on the same controlled document view of customer-relationship economics.