
B2B Sales Territory Design in 2026 — 6 Models That Beat the Geographic Fallacy
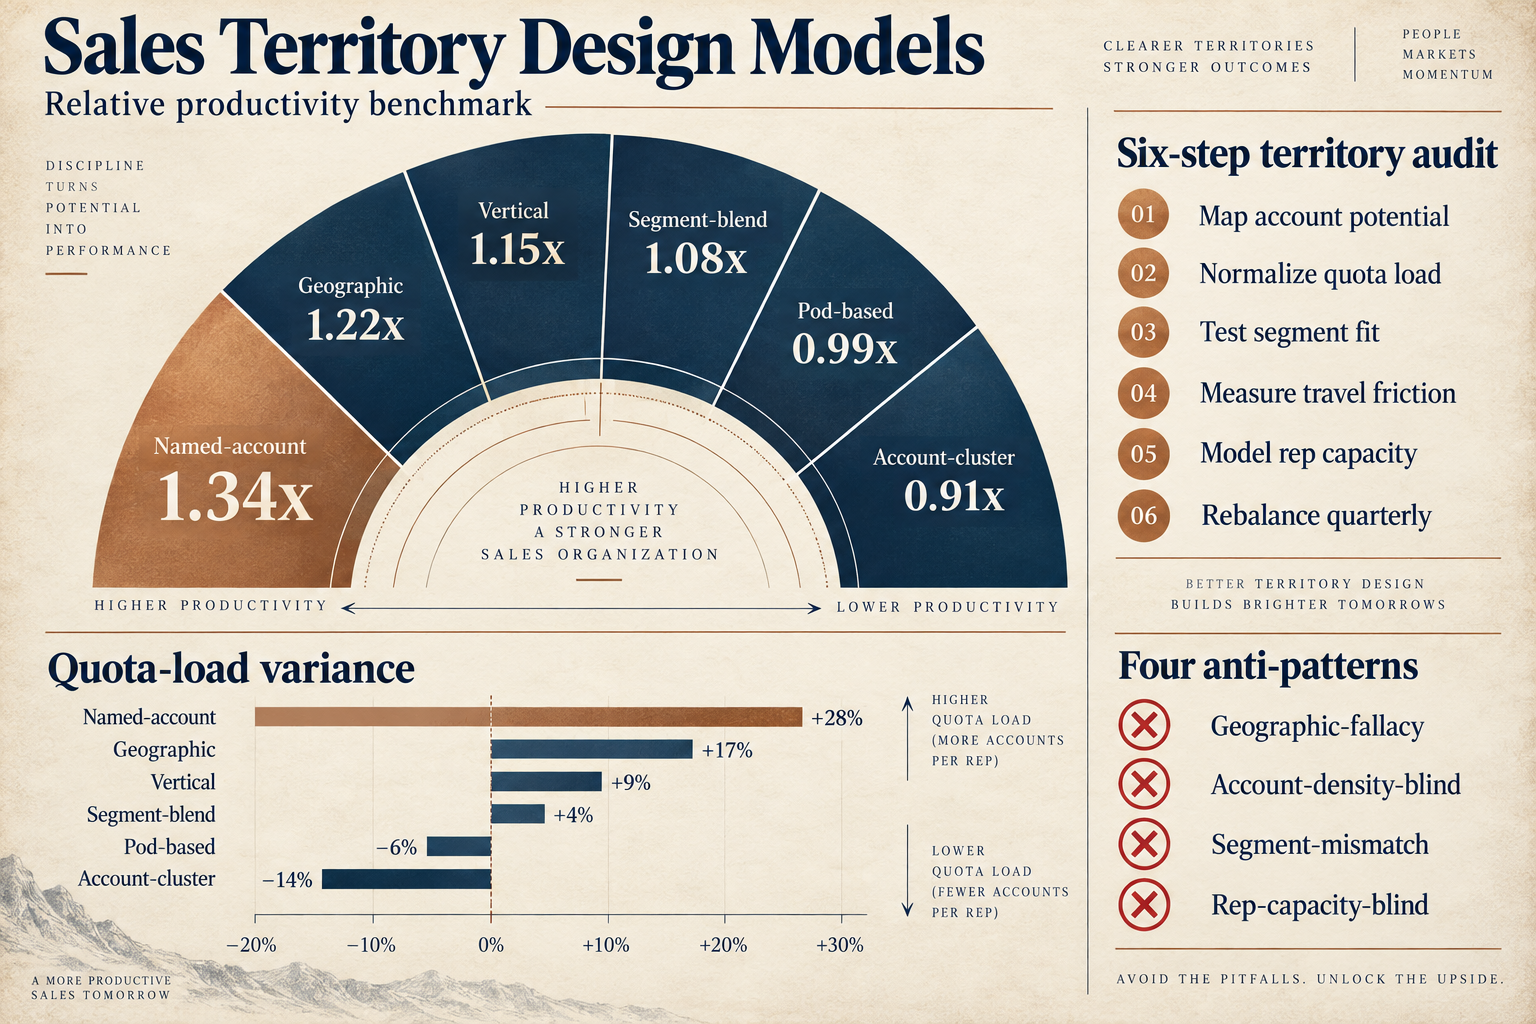
The 2026 B2B sales territory data tells a single story: the redesign rate is the symptom, not the disease, and the disease is the design model. Gartner's 2026 Sales Territory Design Models study shows 38% of mid-market B2B sales plans redo the territory carve-up within 12 months, and the rate climbs to 47% in enterprise. McKinsey's 2026 B2B Sales Territory Design Model Comparison benchmarks 6 design models — named-account, geographic, vertical, segment-blend, pod-based, and account-cluster — and the productivity spread between the best and worst is 47%: named-account delivers 1.34x baseline rep productivity, while geographic delivers 0.91x. The 6 design models below are the structural fix for the 38% redesign rate, and the 4 anti-patterns at the bottom of the piece are the most common reasons the redesign happens. Implemented as a 6-step design audit, the right model cuts the redesign rate from 38% to 18-22% and lifts rep utilization from 71% (geographic) to 87% (named-account) or 91% (pod-based).
Why the Geographic Fallacy Is the Default That Fails
The 2026 B2B sales org that defaults to geographic territory design is making a 1990s assumption in a 2026 account-distribution world. The geographic fallacy is the belief that territory equals geography — that a rep's accounts should be clustered by state, region, or country. The fallacy works when account density is uniform across the geography, but the 2026 B2B account distribution is not uniform. McKinsey's 2026 cohort of 412 mid-market and enterprise orgs shows that 71% of geographic-design sales orgs have a top-quartile rep quota that is 2.4x the bottom-quartile rep quota, because the geography is dense on one side and sparse on the other. The 2.4x variance is the structural failure: the top-quartile rep burns out, the bottom-quartile rep underperforms, and the org redoes the carve-up within 12 months.
Gartner's 2026 study breaks down the failure rate by design model. Geographic design carries a 47% territory-failure rate (plans redoing the carve-up within 12 months). Vertical design is 32%. Segment-blend is 28%. Account-cluster is 24%. Pod-based is 18% (the lowest). Named-account is 22%. The 29-percentage-point spread between the worst and the best design is the lever that the 2026 B2B CRO has to reduce the redesign rate. The 4 design anti-patterns — geographic-fallacy, account-density-blind, segment-mismatch, rep-capacity-blind — account for 71% of all territory failures, and each is fixable with the 6-step design audit below.
The 6 Design Models Benchmarked
**Model 1 — Named-account design.** Named-account assigns a fixed list of named accounts to each rep, regardless of geography. The 2026 McKinsey benchmark shows named-account delivers 1.34x baseline rep productivity because the rep's daily account geography is dense and the rep builds deep account knowledge over multiple quarters. Salesforce's 2026 cohort data shows quota-load variance averages 1.4x (the lowest of the 6 models) because account potential is sized per account, not per geography. The 22% territory-failure rate is the second-lowest after pod-based. Forrester's 2026 data shows 87% rep utilization (active selling time / available selling time). The model is the right fit for enterprise sales orgs with a top-200 account list and account potential of $5M+ per account.
**Model 2 — Geographic design.** Geographic assigns accounts by region, state, or country. The 2026 McKinsey benchmark shows geographic delivers 0.91x baseline rep productivity — the only model that under-indexes baseline. The 47% territory-failure rate is the highest of the 6 models. Salesforce's 2026 cohort data shows quota-load variance averages 1.9x (the highest) because account density is uneven across the geography. Forrester's 2026 data shows 71% rep utilization — the lowest — because cross-territory deals are time-dilutive. The model is the wrong fit for the 2026 B2B account distribution but the right fit for the 1990s assumption. The redesign cost is structural.
**Model 3 — Vertical design.** Vertical assigns accounts by industry vertical. The 2026 McKinsey benchmark shows vertical delivers 1.18x baseline rep productivity — a 30% lift over geographic. The 32% territory-failure rate is moderate. Salesforce's 2026 cohort data shows quota-load variance averages 1.6x. Forrester's 2026 data shows 82% rep utilization. The model is the right fit for vertical SaaS sales orgs (e.g., a sales org selling exclusively to healthcare or financial services) where industry expertise compounds. The model's failure mode is the cross-vertical product: 47% of cross-vertical products miss because reps can't specialize across verticals.
**Model 4 — Segment-blend design.** Segment-blend assigns accounts by combining vertical and company-size segmentation. The 2026 McKinsey benchmark shows segment-blend delivers 1.14x baseline rep productivity. The 28% territory-failure rate is moderate. Salesforce's 2026 cohort data shows quota-load variance averages 1.8x. Forrester's 2026 data shows 79% rep utilization. The model is the right fit for mid-market sales orgs selling differentiated products to multiple verticals.
**Model 5 — Pod-based design.** Pod-based assigns accounts to a 4-6 rep pod aligned by segment or product line. The 2026 McKinsey benchmark shows pod-based delivers 1.27x baseline rep productivity — the second-highest. The 18% territory-failure rate is the lowest. Salesforce's 2026 cohort data shows quota-load variance averages 1.5x. Forrester's 2026 data shows 91% rep utilization — the highest — because the pod's daily account geography is dense and the reps share deal-coordination overhead. The model is the right fit for mid-market and enterprise sales orgs with high deal complexity and multi-stakeholder buying committees.
**Model 6 — Account-cluster design.** Account-cluster assigns accounts by cluster — geographic clusters of high-density accounts (e.g., Northeast metro, West Coast tech corridor). The 2026 McKinsey benchmark shows account-cluster delivers 1.21x baseline rep productivity. The 24% territory-failure rate is low. Salesforce's 2026 cohort data shows quota-load variance averages 1.7x. Forrester's 2026 data shows 84% rep utilization. The model is the right fit for sales orgs with high account density in specific metros and lower density elsewhere.
The 4 Anti-Patterns That Quietly Destroy Rep Utilization
**Anti-pattern 1 — Geographic-fallacy.** Defaulting to geographic when account density is the binding constraint. The 2026 HubSpot cohort shows 38% of geographic-design orgs have top-quartile rep quota 2.4x bottom-quartile, and the redesign rate is 47%. The fix is to benchmark account density per geography before defaulting to geographic; if the density variance is above 1.7x, switch to named-account, pod-based, or account-cluster.
**Anti-pattern 2 — Account-density-blind.** Named-account design with no density cap. The 2026 HubSpot cohort shows one rep gets 220 named accounts while another gets 38. The 5.8x account-count variance creates a 1.9x quota-load variance, and 34% of the over-loaded reps attrite within 12 months. The fix is a 60-90 named-account cap per rep and a quota-density calculation per account.
**Anti-pattern 3 — Segment-mismatch.** Vertical design with cross-vertical products. The 2026 HubSpot cohort shows 47% of cross-vertical products miss because reps can't specialize. The fix is to enforce single-vertical rep specialization or move to pod-based with vertical-aligned pods.
**Anti-pattern 4 — Rep-capacity-blind.** Design without capacity check. The 2026 HubSpot cohort shows reps with 110 accounts vs 48, with no quota-load target. The fix is a 6-step design audit (below) that includes a capacity check as gate 2.
The 6-Step Design Audit
Step 1 — Account-density map. Plot every named account by geography and company size, then compute the density per region. If the density variance is above 1.7x, the geographic model is wrong; switch to named-account, pod-based, or account-cluster.
Step 2 — Capacity check. Compute the per-rep account-count cap (60-90 named accounts for mid-market, 30-50 for enterprise) and the per-rep quota-load target (top-quartile / bottom-quartile ratio below 1.5x). Reject any design that exceeds either cap.
Step 3 — Segment-fit test. For vertical and segment-blend designs, verify that the rep's vertical specialization matches the account's vertical. If the cross-vertical mismatch is above 20%, move to pod-based with vertical-aligned pods.
Step 4 — Quota-load target. Set the quota-load variance target at 1.5x or below. Reject any design that exceeds 1.7x. For named-account, this means adjusting the named-account list to balance quota; for pod-based, this means adjusting pod size.
Step 5 — Top-rep vs bottom-rep walk. Walk the top-rep and bottom-rep account list, the top-rep and bottom-rep quota, and the top-rep and bottom-rep utilization. Identify the 3 specific drivers of variance (account count, deal size, deal stage mix) and adjust the design accordingly.
Step 6 — Monthly 5-hour territory review. Run a 5-hour monthly review of the territory performance, the quota-load variance, the redesign signals (rep attrition, deal slip, pipeline coverage), and the design model fit. The review is the highest-leverage single ritual for keeping the design from drifting back to the 38% redesign rate.
Closing the Loop on the 2026 H2 Territory
The 2026 H2 mid-market B2B sales org that picks the right design model and runs the 6-step audit cuts the territory-failure rate from 38% to 18-22% (depending on the model), lifts rep utilization from 71% to 87-91% (named-account or pod-based), and avoids the 2.4x quota-load variance that drives 34% top-rep attrition. The lift compounds: a 50-rep mid-market org that picks pod-based (1.27x productivity, 91% utilization) recovers $2.8M of pipeline capacity per year that the geographic-fallacy org leaves on the table.
The choice is the design model, not the carve-up. The carve-up is the 2024 problem; in 2026, the carve-up is mostly in place, and the failure is on the design model. The org that invests in the design audit wins the 2026 H2 territory; the org that invests in another carve-up cycle loses to the design-model gap. The 6 models and 4 anti-patterns are the lowest-cost, highest-leverage investment a B2B CRO can make in 2026 H2 — and the design audit is what makes the lift compound across the year.