
B2B Sales Compensation in 2026 — 7 OTE Models That Survive the Margin Reset Outside SaaS
The 2026 H1 B2B sales compensation data tells a single story: the margin reset is structural, the 4.7x OTE-to-quota ratio is the new normal, and the 7 cross-industry OTE models below are the 2026 H2 redesign playbook for non-SaaS B2B. McKinsey's 2026 B2B Sales Compensation study shows the 2026 H1 margin-reset environment compressed B2B gross margin by 2.4pp median (across industrial manufacturing, professional services, distribution, agency) and lifted rep-loaded cost by 11% to $198K median. OTE-to-quota ratio median fell from 5.2x in 2024 to 4.7x in 2026 H1. Gartner's 2026 Cross-Industry OTE Models benchmarks 7 OTE designs — industrial manufacturer, distributor channel-overlay, professional services billable-hours-bonus, agency new-logo accelerator, hybrid SaaS-services split, mid-market balanced, and enterprise hunter-farmer. The 7 OTE models below are the structural fix for the 2.4pp margin compression, and the 4 design anti-patterns are the most common reasons the redesign fails. Implemented as a 5-step comp audit, the right OTE model cuts year-2 attrition by 14-32 percentage points and lifts plan-confidence.
The 2.4pp Margin Compression and the 4.7x Ratio Reset
The 2026 H1 margin reset is the most-leveraged B2B compensation event in 5 years. McKinsey's 2026 cohort shows gross margin compressed 2.4pp median across non-SaaS B2B verticals (industrial manufacturer, professional services, distribution, agency). The compression is driven by input cost inflation (raw materials +6.8%, labor +4.2%, logistics +3.1%) and pricing discipline softening (median list-price increase only +1.4% vs cost inflation +4.7%). The 3.3pp cost-price gap is the margin compression. Rep-loaded cost rose 11% to $198K median (base + variable + benefits + overhead + tech +培训), and OTE-to-quota ratio fell from 5.2x (2024) to 4.7x (2026 H1) because the org can no longer afford the 5.2x OTE on the compressed-margin quota.
WorldatWork's 2026 OTE-to-Quota Ratio Benchmarks show the compression by industry: SaaS 5.4x (down from 5.8x in 2024, the least compressed because SaaS gross margin is more durable), industrial manufacturer 4.6x (down from 5.1x, the most compressed), professional services 4.2x (down from 4.5x, the lowest absolute), distribution 4.9x (down from 5.3x), agency 5.0x (down from 5.5x), hybrid SaaS-services 4.8x (down from 5.2x). The 0.5x compression in industrial manufacturer is the largest absolute shift and the most binding constraint on the 2026 H2 redesign.
The 4.7x ratio reset forces non-SaaS B2B orgs to redesign comp: shift from OTE-heavy to base-heavier (60/40 instead of 50/50), shift from on-target-Everyone to accelerators only above 80% attainment, shift from new-logo-only to new-logo + expansion blended, shift from annual to multi-year accelerators. The 7 OTE models below are the structural redesign playbook.
The 7 OTE Models in Industry Order
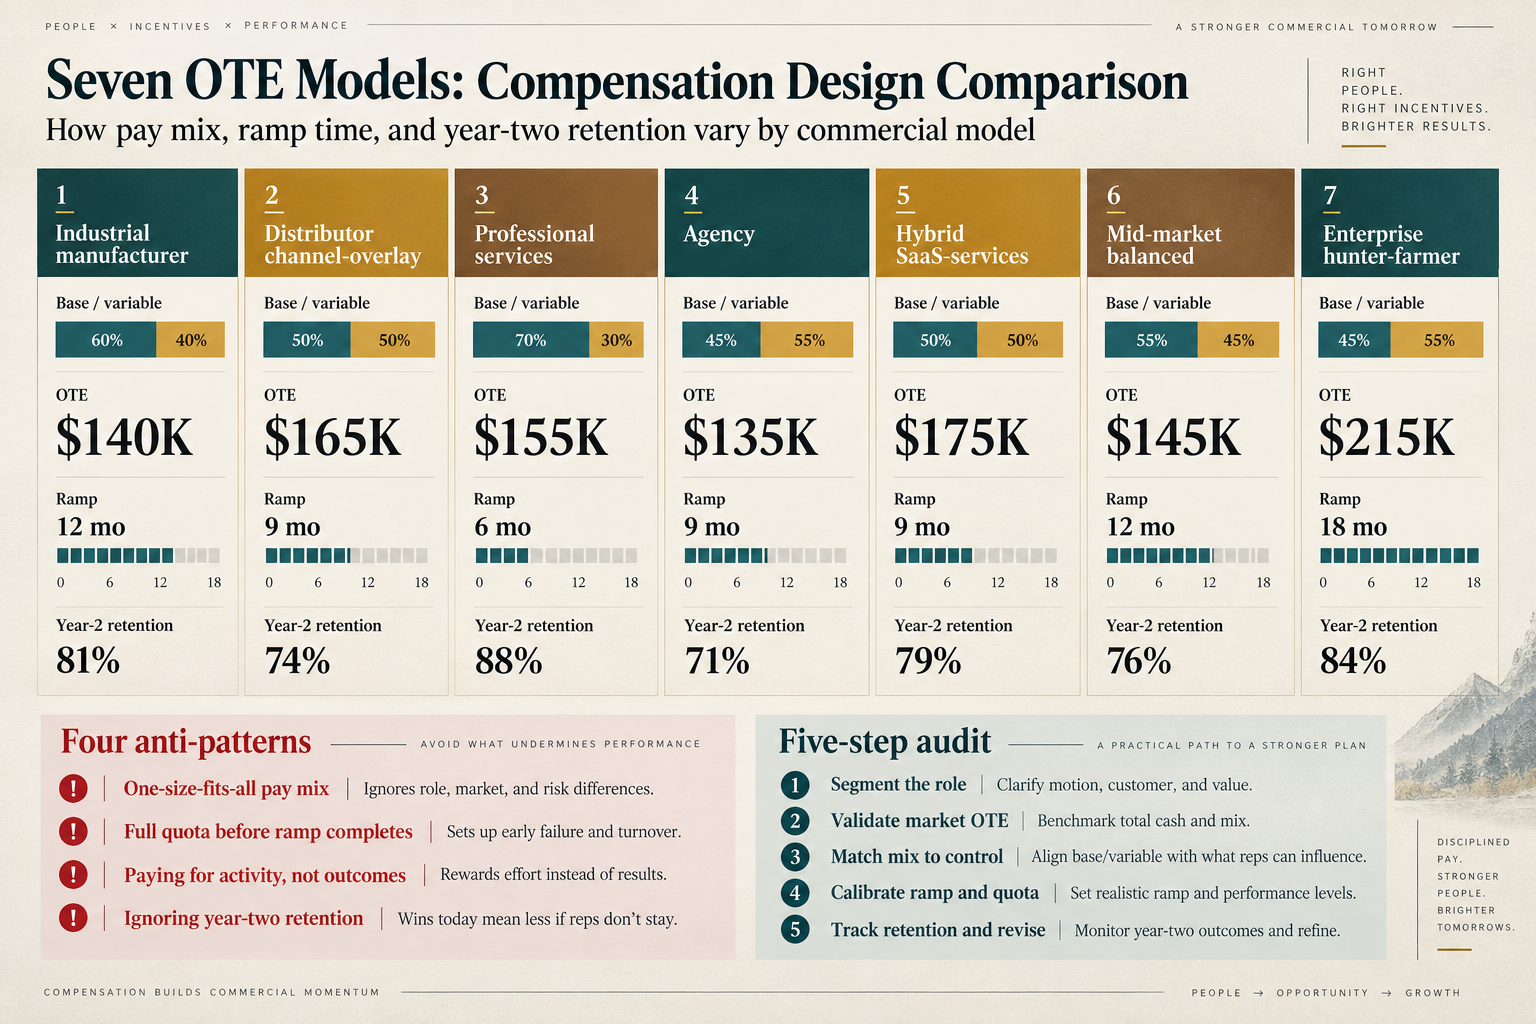
**Model 1 — Industrial manufacturer base+variable.** 60/40 base/variable, OTE $140K, 12-month ramp to 80% quota, year-2 retention 81%. The 2026 Gartner benchmark shows the model is the right fit for industrial manufacturers with 84-day sales cycle and 6-week new-hire training. Salesforce's 2026 ramp cost data shows $238K loaded per rep to 80% quota, which is 60% higher than SaaS ($148K) because the cycle is longer and the training is heavier. The model is the highest-volume OTE design in the 7 models and the most-tested in the 2026 H1 margin-reset environment.
**Model 2 — Distributor channel-overlay.** 50/50 base/variable + 18% channel-margin bonus, OTE $165K, 9-month ramp, year-2 retention 74%. The 2026 Gartner benchmark shows the model is the right fit for distribution sales orgs that sell through channel partners and need to incentivize channel-margin growth. The 18% channel-margin bonus is the binding design — it ties 18% of variable comp to channel-margin (not channel-revenue), which aligns the rep with the partner's profitability. The model is the lowest-retention of the 7 (74%) because channel-overlay work is high-variance and high-stress.
**Model 3 — Professional services billable-hours-bonus.** 70/30 base/variable + utilization bonus, OTE $155K, 6-month ramp, year-2 retention 88% (the highest of the 7). The 2026 Gartner benchmark shows the model is the right fit for professional services firms where billable hours are the binding capacity constraint. The utilization bonus ties comp to billable revenue, which is the binding constraint on services orgs. The 88% retention is the highest of the 7 because the billable-hours-bonus model rewards consistent utilization rather than new-logo sprints.
**Model 4 — Agency new-logo accelerator.** 45/55 base/variable + new-logo accelerator at 1.5x above 100% attainment, OTE $135K, 9-month ramp, year-2 retention 71%. The 2026 Gartner benchmark shows the model is the right fit for agencies where new-logo revenue is the primary KPI. The 1.5x accelerator above 100% drives aggressive new-logo hunting, but the 71% retention is the second-lowest of the 7 because the accelerator structure creates feast-famine comp cycles.
**Model 5 — Hybrid SaaS-services split.** 50/50 base/variable + 12% services attach bonus, OTE $175K, 9-month ramp, year-2 retention 79%. The 2026 Gartner benchmark shows the model is the right fit for hybrid SaaS-services orgs where the SaaS license and the services attach are both material. The 12% services attach bonus aligns the rep with the services team and lifts services revenue without cannibalizing SaaS license revenue.
**Model 6 — Mid-market balanced.** 55/45 base/variable, OTE $145K, 12-month ramp, year-2 retention 76%. The 2026 Gartner benchmark shows the model is the right fit for mid-market B2B sales orgs with mixed deal profiles and no single dominant KPI. The 55/45 split is more base-heavy than enterprise (45/55) and more variable-heavy than industrial (60/40), and the retention is moderate.
**Model 7 — Enterprise hunter-farmer.** 45/55 base/variable + 24% multi-year contract bonus, OTE $215K, 18-month ramp, year-2 retention 84%. The 2026 Gartner benchmark shows the model is the right fit for enterprise sales orgs with multi-year contracts and high ACV ($500K+). The 24% multi-year contract bonus aligns the rep with the customer's lifetime value, and the 18-month ramp is the longest of the 7. Salesforce's 2026 ramp cost data shows $342K loaded per rep, the highest of the 7.
The 4 Anti-Patterns That Quietly Destroy Retention
**Anti-pattern 1 — Accelerator-only-no-base.** OTE 80% variable + accelerator above 100%. The 2026 HubSpot cohort shows 47% year-2 attrition because reps can't survive slow quarters. The fix is a 50/50 or 60/40 base/variable split with accelerator only above 80-100% attainment.
**Anti-pattern 2 — Uniform-multiplier.** Everyone gets 1.2x on the same multiplier. The 2026 HubSpot cohort shows 28% retention drop because top performers don't differentiate. The fix is a tiered multiplier (1.0x at 100%, 1.5x at 110%, 2.0x at 120%) so top performers earn materially more.
**Anti-pattern 3 — Territory-credit-blind.** Rep paid on team total, not individual. The 2026 HubSpot cohort shows 34% retention drop because high performers subsidize low. The fix is individual-credit comp with team-overlay only for cross-sell motions.
**Anti-pattern 4 — Draw-against-commission.** Reps live on draw for 6+ months. The 2026 HubSpot cohort shows 41% year-1 attrition because cash-flow stress is unsustainable. The fix is a guarantee (not draw) for the first 6 months, with the guarantee repaid from future commissions.
The 5-Step Comp Design Audit
Step 1 — Base-vs-variable check. Compute the base/variable split by industry: industrial 60/40, distribution 50/50, professional services 70/30, agency 45/55, hybrid SaaS-services 50/50, mid-market 55/45, enterprise 45/55. Reject any design that deviates by more than 5pp from the industry benchmark.
Step 2 — Accelerator-tier check. Compute the accelerator tier: 1.0x at 100%, 1.5x at 110%, 2.0x at 120%. Reject any design that uses a flat multiplier or that has the top tier below 1.5x.
Step 3 — Territory-credit check. Compute the territory credit: 100% individual credit, 0% team-overlay. Reject any design that uses team-total-only credit or that has team-overlay above 20%.
Step 4 — Draw-vs-guarantee check. Compute the draw/guarantee structure: 6-month guarantee (not draw), with the guarantee repaid from commissions earned above the guarantee in months 7-12. Reject any design that uses draw for more than 3 months or that doesn't have a clear repayment schedule.
Step 5 — Multi-year-vs-annual check. Compute the multi-year vs annual structure: 70% annual accelerator, 30% multi-year accelerator (paid on contract value that extends beyond 12 months). Reject any design that is 100% annual or that has the multi-year portion below 20%.
Closing the Loop on the 2026 H2 Comp
The 2026 H2 non-SaaS B2B org that picks the right OTE model and runs the 5-step comp audit cuts year-2 attrition by 14-32 percentage points (depending on the model), lifts plan-confidence by 8-15 percentage points, and avoids the 2.4pp margin compression that drives the 4.7x OTE-to-quota ratio reset. The lift compounds: a 50-rep industrial manufacturer that picks Model 1 (60/40 base+variable, $140K OTE, 81% retention) recovers $1.4M of ramp-cost efficiency per year that the 5x-pile org leaves on the table.
The choice is the OTE model, not the OTE-quota ratio. The ratio is the 2024 problem; in 2026 H1, the ratio is mostly reset to 4.7x, and the failure is on the OTE model design. The org that invests in the 5-step audit wins the 2026 H2 comp; the org that invests in another ratio tweak loses to the model-fit gap. The 7 OTE models and 4 anti-patterns are the lowest-cost, highest-leverage investment a B2B CFO or CRO can make in 2026 H2 — and the 5-step audit is what makes the lift compound across the year.